Power BI Analytics Platform
Analytics dashboard demo presenting business data and reports for decision makers.
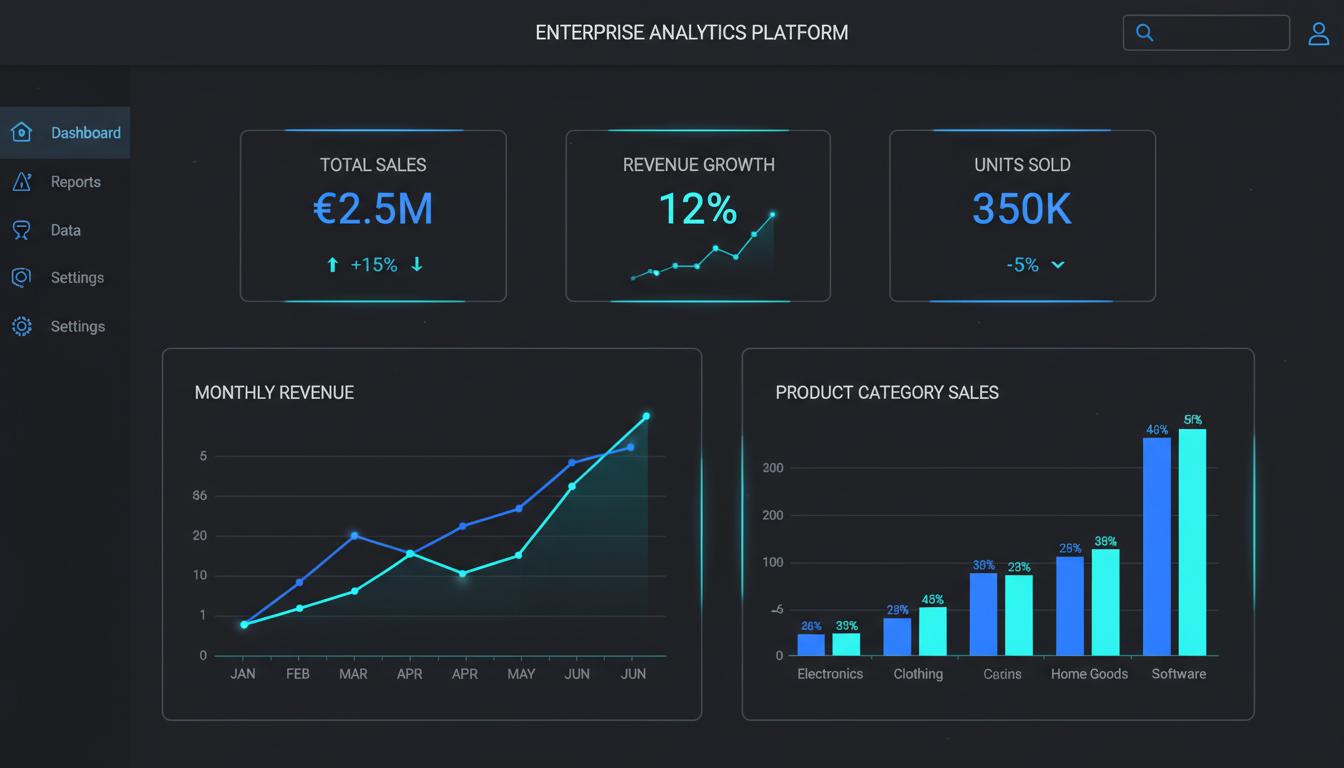
Analytics in a browser
This portfolio demo focuses on presenting business intelligence through a dashboard. It represents the reporting side of a business application: turning data into views that a decision maker can explore, rather than exposing raw records alone.
What the example represents
The listed stack includes React, TypeScript, D3.js, and WebGL. It is presented as an interactive analytics demonstration, not a claim of a deployed Microsoft Power BI integration or independently measured reporting-time savings.
Explore the work
Use the external project link to explore the available experience. External sites may change or require access. For a similar build, describe your users, workflow, integrations, and delivery constraints so the relevant scope can be discussed.